Graph DB-based data analysis and utilization service
Dramatic data analysis created by Node and Edge Graph DB-based data
analysis consulting that derives business value through relationship and insight between data
Numerous data that exist in the world are connected with relationships. Graph DB is a database optimized for specifying the relationship between data
and finding the proportion of insight and value generated from the correlation between data.
Encore Data Service Center provides graph DB-based data analysis and utilization services that can improve the efficiency of business
processes and derive new business values by analyzing the insights of various and complex data
Encore Data Service Center provides graph DB-based data analysis and utilization services that can improve the efficiency of business processes
and derive new business values by analyzing the insights of various and complex data held by companies.

Encore's graph DB-based data analysis
and utilization consulting service?
By analyzing the correlation between various and complex data based on the graph DB, it provides a high-level data insight that
has never been experienced before. Using the graph DB that is optimal for customer needs and business,It provides new business value
as well as the efficiency of business processes.
-
01
Korea's best graph DB expert group
Graph DB's Network Theory experts. -
02
Data Service Center led
by Hwasik Lee, CEO -
03
Partnership with Graph DB companies Efficient business cooperation by signing partnerships with major GraphDB companies (Neo4j, TigerGraph)
-
04
provides customized services by encore's proprietary graph DB methodology
-
05
Provide consulting based on excellent domain knowledge about any graph DB
-
06
Flexible linkage support with Encore corporate data management consulting
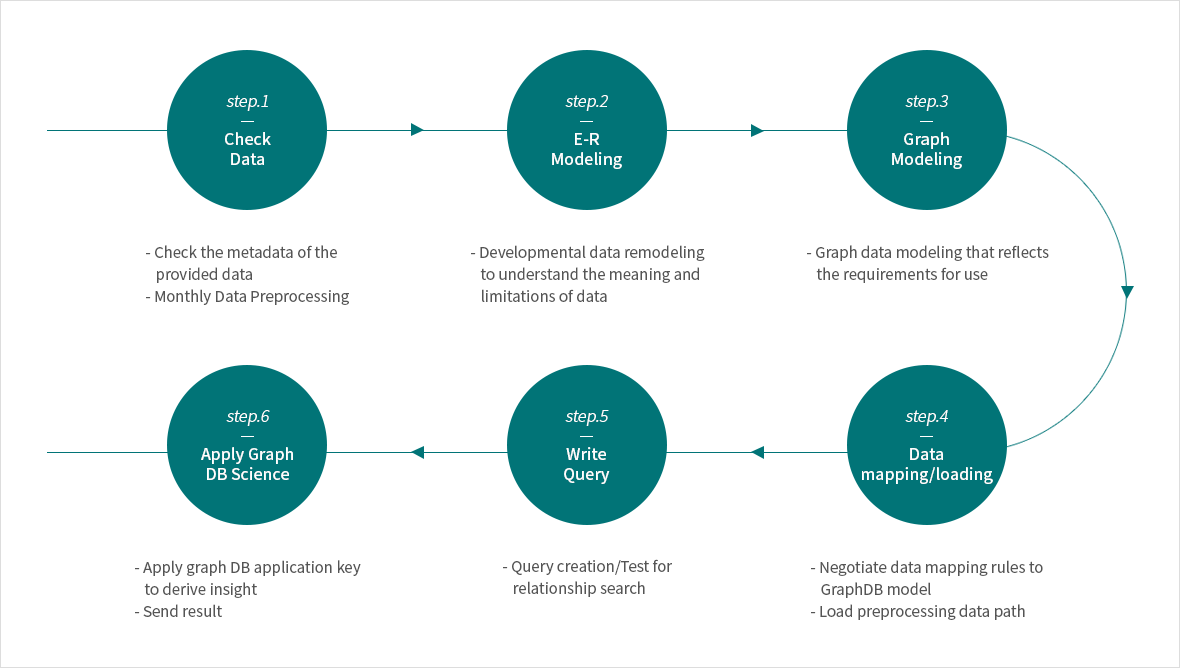
What is Encore's graph DB methodology?
-
Systematic graph DB
construction methodology -
Accurate and fast graph DB
construction by methodology -
Provide graph DB modeling
optimal for domain characteristics
We build an optimal graph database to strategically utilize by searching a graph database suitable for the characteristics of the industry and business.
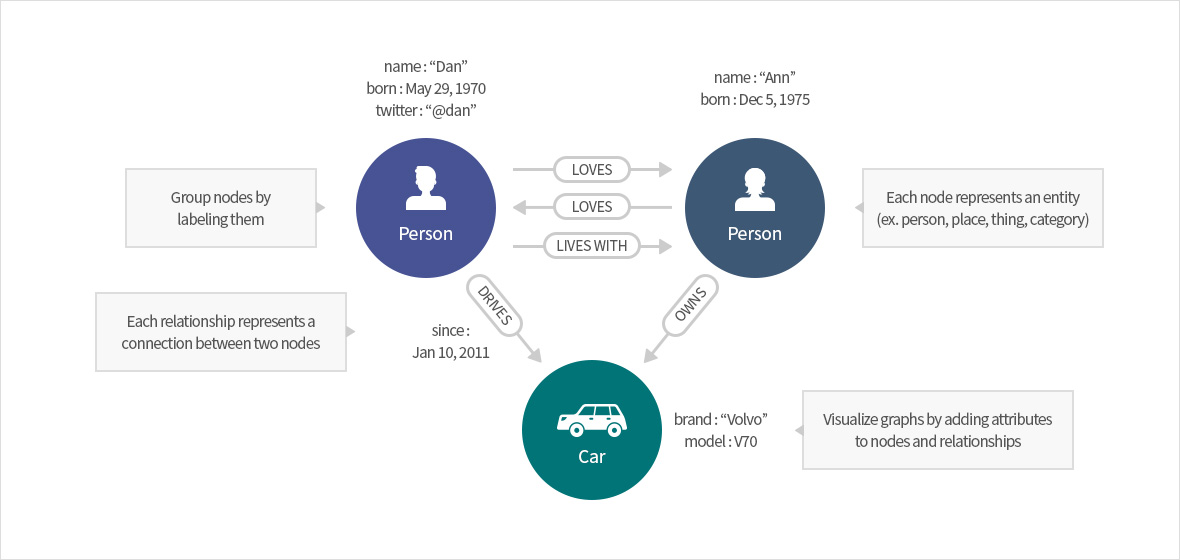
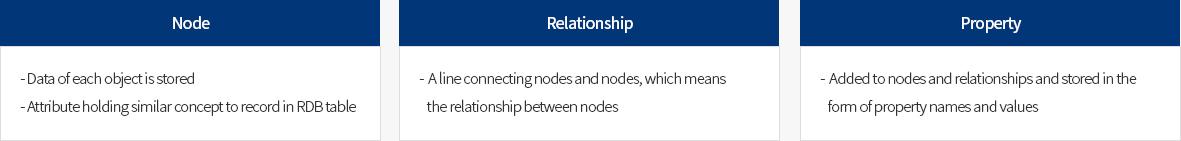
Graph Database?
A graph database is based on graph theory and is composed of nodes, relationships (relation/edges), and properties. can be checked by edge, Through edge, the relationship between nodes is stored and visualized, correlation between data can be visible
Graph DB Application and Utilization
-
1
사회 관계망 분석 (Social Network Analysis)
- Easy to describe how people interact
→ Interconnection (relationship) with many users (nodes)
- Graph database enables efficient search based on relationships
ex. SNS companies try graph DB-based system for customers and users -
2
biology/medicine
- Structures of molecules, genes, etc., or their interactive relationships can be modeled and stored through graph structures.
- Brain connections can be mapped and visualized in graphs
ex. New drug development, gene research, etc. -
3
Network and Route
- It can be used to calculate the optimal path between two nodes.
- Path search, link prediction, impact analysis, etc.
- Optimal path search according to given constraints.
ex. Railroad, road network, communication network, supply chain, road network, etc. -
4
Fraud Detection
- Unlike conventional methods that focus on individual data points such as specific
accounts, devices, IP addresses, etc., it is possible to review linked data.
- Use relationships to handle a variety of financial crimes in real time, including bank fraud, credit card fraud, and e-commerce fraud
- Easy to understand relationships between multiple people connected to one account (email, IP address, etc.) -
5
Marketing & Recommendation Engines
- Customer-related information (fields of interest, friends, purchases, etc.) can be stored in graph form
- Recommend products or friends using purchase information or relationships of other customers with similar histories to yours
- Since there is no JOIN, the processing speed is constant, so real-time recommendation is possible in the graph database.
-
6
Knowledge Graph
- Advanced search function that provides the user with a wealth of necessary information in the form of a graph of related data of the knowledge graph
- Store information in graphs to efficiently explore highly interconnected data
- Ability to link and explore information from disparate data sources
Comprehensively control the structure, performance, and sales achievement
- CompanyA사
- ProjectAnalysis and monitoring Sales organization network influence
-
Purpose and Background
Analyzing the structure of a large-scale sales organization and the correlation and influence of members within the network, and quantifying the characteristic weights to visualize and monitor performance and sales achievement rates to support data analysis and prediction of sales achievement potential
-
Features
A company's sales organization structure is zoomed in and zoomed out macroscopically, and growth potential and key indicators can be viewed in the organization chart according to the correlation between each data, and the relationship and weight of various evaluation indicators such as customer lifetime value, growth potential, and centrality are graphed. It is a business that builds a graph DB analysis platform so that it can be analyzed and visualized as a DB and used for review and monitoring for decision-making.
-
1
Quantification of all influence relationships and
characteristic values inherent among members- Continuously manage the relationship and detailed details of mutual influence on sponsorship allowance, position allowance, and training allowance
- Perform quantification by scoring very diverse characteristics of members using various algorithms
- Build a platform that can accumulate data sources for graph DB for a long time to enable advanced analysis using network theory -
2
Search and visualize various
forms of membership structure- The basic structure of member organizations applied with the concept of short cut and scale is searched by various conditions.
- Exploring the structure visualized by various characteristics of members in the organization
- Visualization of the member organization that actually falls within the jurisdictional sphere of influence when various performances that have occurred during a specific period are reflected -
3
Real-time position achievement
probability monitoring- Monitoring the change in the possibility of achieving a specific position based on real-time generated sales
- Alerting warning information when a red flag occurs in the possibility of achievement compared to past occurrence patterns
- Develop countermeasures by simulating how high the probability of achieving my position increases when some members' performance is improved
-
1
Quantification of all influence relationships and
-
Utilization technology
- Understand the need for structural analysis and various forms of the inherent organizational structure due to the disadvantages of Binary Network Marketing
- In general, there is a high possibility of biased sponsorship according to small or large sales, and communication is also cut off depending on the leader's propensity.
- There are many small organizations according to the ‘upper and lower down’ policy, and only about 10% of members receive sponsorship allowances.
- Improving into a healthy organization by adding and predicting inherent relationships based on a graph database and quantifying organizational structure characteristics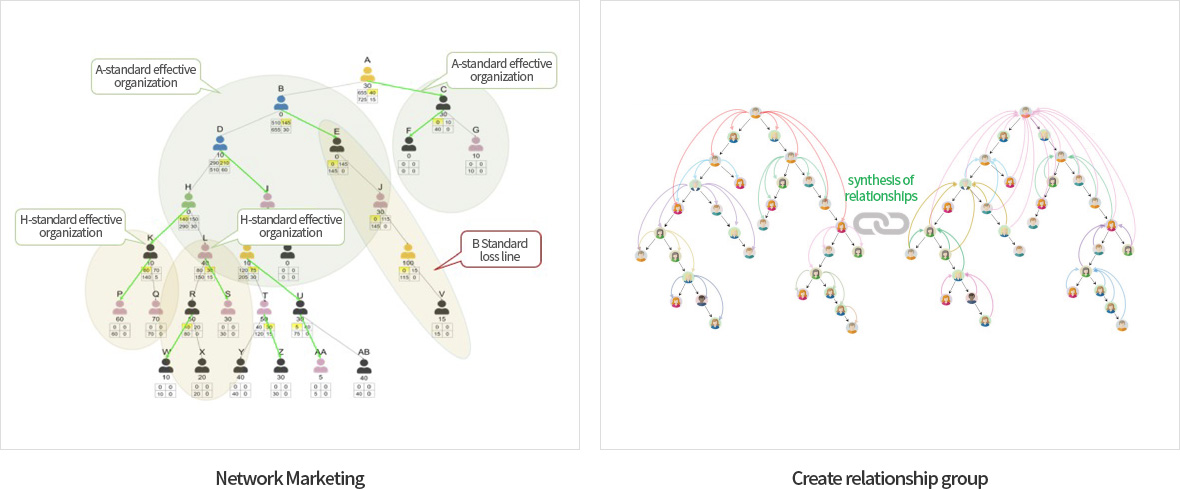
Graph DB Partnership
Encore provides customer-customized data analysis services by partnerships with major global graph
DBs and utilizing graph DBs suitable for customer needs and project characteristics.
-

- - Opensource graph database
- - Most Popular Graph Database
- - Supports cypher, a graph query language similar to SQL
- - ACID compliant Transactional Database
- - Provide visualization through its own app, Bloom, library, or linkage
- - Can add indexes to properties and labels
- - Certain features are paid features
-

- - Supports GSQL, a graph query language similar to SQL
- - Queries can complete more than 6 hops
- - Optimized for large-scale, high-volume processing
- - Visualization support through built-in IDE GraphStudio
- - Requires less storage space than others